Employee experience in IT explained for device lifecycle leaders
Employee experience in IT is the measurable effect that device provisioning, swaps, loaner issuance, returns and support fulfilment have on how quickly staff get back to productive work. It is not a satisfaction survey score sitting in isolation. It is an operational outcome, and right now it is a poor one: employees lose an average of 3 hours 18 minutes of productive time per IT incident, according to HappySignals’ 2026 benchmark of 1.77 million responses.
That figure is the business case in one number. Two proof points frame the rest of this article:
- The industry benchmark: 3.3 hours lost per incident, driven disproportionately by tickets requiring multiple handoffs.
- The Velocity Smart outcome: a global pharmaceutical customer running Smart Collect® recorded a substantial uplift in IT service throughput and a significant reduction in employee downtime.
Statistic in focus: the gap between those two numbers is the entire opportunity for automated fulfilment.
Key Takeaways
Employee experience in IT improves fastest when device fulfilment is automated natively inside ServiceNow rather than bolted on through separate tools or middleware.
| Point | Details |
|---|---|
| Lost time is the real metric | Employees lose 3.3 hours per IT incident on average, the number every automation business case should reference. |
| Handoffs cause disproportionate loss | A small share of tickets with multiple reassignments drives most of the lost productivity, so target that segment first. |
| Native integration protects trust | CMDB custody events, RBAC and audit trail must sit inside the existing ServiceNow tenant, not a synced parallel system. |
| Feedback needs a timestamp | Pair experience ratings with fulfilment timestamps to diagnose which workflow step is actually failing. |
| Velocity Smart’s Smart Collect® | Delivered a 500%+ throughput uplift and 74% less downtime for a pharma customer, running natively on ServiceNow. |
Table of Contents
- Why employee experience in IT explained matters to business leaders
- Mapping the operational components: provisioning, swaps, loaners and returns
- Self-service hardware: lockers, vending and kiosks explained
- Measuring impact: the KPIs that prove ROI to the C-suite
- Rollout and scale playbook: from pilot to enterprise operating model
- Evidence and credentials behind Smart Collect® outcomes
- How employee experience in IT shapes engagement and retention
- Feedback mechanisms and continuous improvement in employee experience
- Beyond hardware: software tools and interfaces that complete the experience
- What successful IT experience programmes actually look like
- Common pitfalls that undermine employee experience programmes
- Where employee experience technology in IT is heading
- The overlooked truth about employee experience in IT
- Where to learn more about Smart Collect® and request a briefing
- Sources
Why employee experience in IT explained matters to business leaders
Every hour an employee spends waiting for a laptop swap or a peripheral replacement is an hour the business already paid for and did not receive. At 3.3 hours lost per incident across a workforce of several thousand, the annualised cost runs into millions before anyone touches a P&L line for “IT support.” That is why understanding employee experience in IT has moved from a helpdesk metric to a board-level cost conversation.
The mechanism matters as much as the headline number. HappySignals found that just a small percentage of tickets involving multiple reassignments account for a disproportionate share of lost productivity — the handoff, not the fix, is what erodes experience. Meanwhile, when support feels slow or indifferent, employees stop asking for help altogether. More than 28% of employees have stopped raising IT issues, and 52% now use personal devices or unauthorised tools instead, which is shadow IT by another name and a governance risk few CIOs have fully priced in.
What actually moves the needle:
- Speed accounts for roughly 29% of experience improvement, more than any other lever.
- Agent attitude and skill together account for a further 39%.
- First-time fix reduces the handoff chains that create the worst outliers.
Ivanti’s 2025 research backs the automation response directly: a large majority of IT professionals say effective digital employee experience management improves productivity, and automating repetitive fulfilment tasks is their top stated priority.
Mapping the operational components: provisioning, swaps, loaners and returns
Employee experience in IT is built or broken across five recurring physical workflows. Each one has a point where manual process typically fails, and each failure point shows up later as a downtime statistic.
- Onboarding and provisioning. A new starter’s kit — laptop, monitor, peripherals — must be built, tested and delivered before day one. Manual staging usually means kit sits in a cupboard awaiting a technician, and the CMDB record is updated after delivery rather than at the point of handover.
- Device swap. A failed laptop triggers a replacement request, an engineer dispatch, and a physical exchange. Every step between “fault reported” and “replacement in hand” is downtime, and it is the step most exposed to the 3.3 hour average.
- Loaner issuance. Short-term equipment for travel, contractors or interim cover requires fast checkout and equally fast recovery, but loaner pools are notoriously under-tracked because they sit outside the standard asset register.
- Returns and decommissioning. Leavers’ equipment, end-of-life devices and loaner recovery all depend on someone actually bringing the kit back. Late or missing returns are the single biggest source of asset shrinkage in most estates.
- Custody logging. Every one of the four steps above needs a timestamped, RBAC-governed custody event written to the CMDB at the moment of handover, not reconciled days later by a spreadsheet.
The common failure mode across all five is the same: manual reconciliation between what the ticket says happened and what the inventory system shows. That gap is where asset loss, audit findings and employee downtime all originate.
Self-service hardware: lockers, vending and kiosks explained
Self-service hardware removes the technician from the physical handover step, which is precisely the step that drives most of the 3.3 hour average. Three form factors cover distinct use cases, and choosing the wrong one for the job is the most common design mistake.
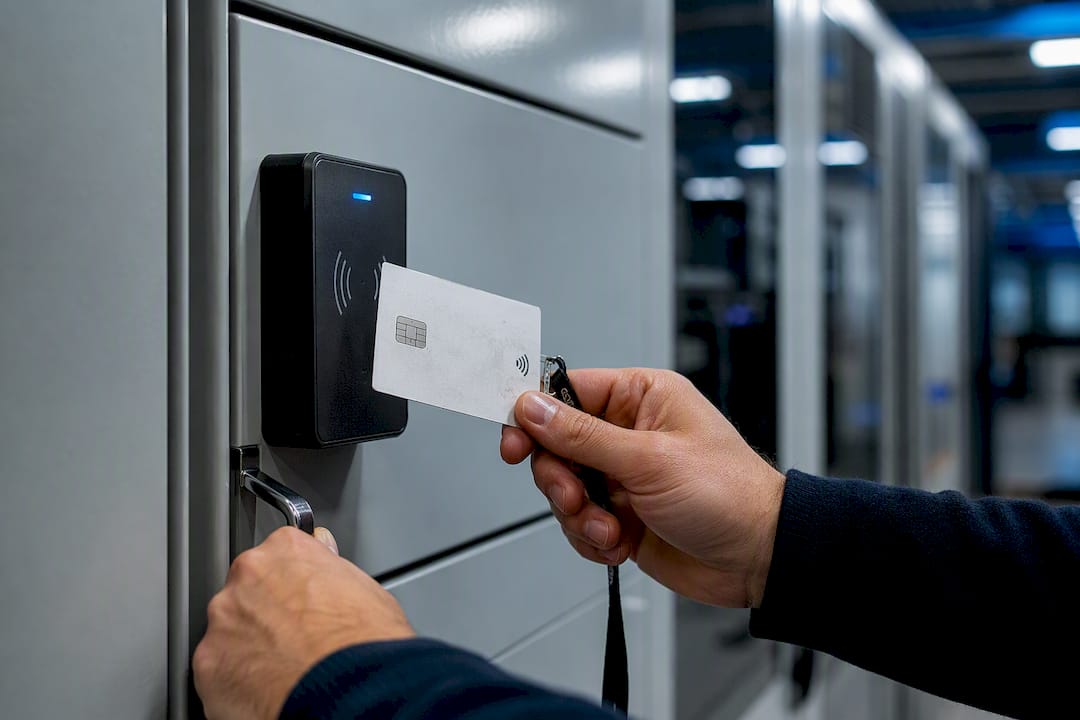
- Smart lockers handle full-device handovers: new-starter kit delivery, laptop swaps, loaner checkout and returns. An employee receives a notification, walks to the locker, authenticates and collects. No technician needs to be present.
- Smart vending dispenses peripherals and consumables — mice, headsets, cables, dongles — on demand, 24 hours a day, without a ticket ever reaching a service desk queue.
- Smart kiosks replace the walk-up help desk with a virtual tech-bar, pairing self-service hardware collection with a video-based support resolver for issues that need a human conversation rather than a swap.
Fulfilment speed is the differentiator across all three: a locker collection takes minutes rather than the hours or days a dispatched engineer requires, and availability is not bound to shift patterns.
Required integrations are non-negotiable rather than optional extras. Identity federation controls who can open which locker compartment, RBAC governs which technician or employee sees which inventory, and a native ITSM connector writes the custody event straight into the CMDB at the point of collection, not afterwards.
Pro Tip: Match the form factor to the ticket type before you buy hardware. If most of your volume is peripheral requests rather than full-device swaps, a vending deployment will show ROI faster than a locker estate, and reviewing your own ticket taxonomy first avoids over-specifying the pilot.
Measuring impact: the KPIs that prove ROI to the C-suite
Five metrics separate a credible business case from an anecdote: time-to-fulfil, employee downtime per incident, first-time fix rate, ticket handoff count, and shadow IT incidence. Each one is measurable today from data most enterprises already hold in ServiceNow, and none require a new survey instrument to start tracking.
The method that works is joining experience data to operational timestamps rather than treating them separately. A satisfaction score on its own tells you employees are unhappy; joined to fulfilment timestamps and CMDB custody events, it tells you which specific workflow step is causing that unhappiness.
| Metric | What it reveals |
|---|---|
| Time-to-fulfil | Elapsed time from request to physical handover, the direct driver of downtime |
| Employee downtime per incident | Benchmarked against 3.3 hours industry average to size the gap |
| First-time fix rate | Correlates directly with the a small percentage of tickets causing outsized loss through reassignment |
| Ticket handoff count | Flags the small ticket cohort responsible for most lost productivity |
| Shadow IT incidence | Signals where friction has pushed employees toward unauthorised tools |
Rollout and scale playbook: from pilot to enterprise operating model
Scaling self-service fulfilment across multiple sites fails most often when governance is bolted on after the pilot rather than designed before it. A four-phase approach keeps risk contained while proving value fast.
- Phase 0: Scope the pilot. Pick one site and one ticket type, ideally the highest-volume device swap or loaner category, and define success metrics before installation begins.
- Phase 1: Integrate. Connect identity, network and the ServiceNow connector so every custody event lands natively in the CMDB. A typical site survey, installation and connector configuration runs across roughly four weeks, with the final week reserved for user acceptance testing and training.
- Phase 2: Set security and SLAs. Lock down RBAC roles, define audit trail retention, and set escalation rules for overdue returns before go-live, not after the first missing device.
- Phase 3: Govern and expand. Standardise policy across regions before adding sites, so a second location does not inherit an inconsistent RBAC model or a different SLA definition.
Operational controls matter more than the hardware itself. RBAC determines who can open which compartment; the audit trail proves compliance to auditors and regulators without a separate reconciliation exercise; return-enforcement rules with automated escalation stop loaners quietly disappearing.
Adoption depends on change management as much as engineering. Communicate the “why” before go-live, design the collection journey so it takes under two minutes, route repeat non-returns to line managers rather than IT, and report fulfilment metrics on the same cadence as other service KPIs.
Pro Tip: Run your pilot’s success metrics as a direct comparison against the 3.3 hour industry benchmark rather than an internal baseline alone. Leadership responds faster to “we beat the industry average” than “we improved on last quarter.”
Evidence and credentials behind Smart Collect® outcomes
Enterprise IT leaders are right to ask for proof before automating a physical workflow that touches every employee. The measured outcomes on Smart Collect® were delivered under traditional ITSM workflows, before agentic AI was driving any part of the process, which makes them a floor rather than a ceiling as ServiceNow’s Now Assist matures.
- A global pharmaceutical customer recorded a 500%+ uplift in IT service throughput, 83% faster fulfilment and 74% less employee downtime.
- A US nuclear energy operator cut on-site tickets by 60% and reclaimed 31 to 42% of IT staff time.
- A US aerospace and defence customer reduced IT staff travel by 35% across more than 34 sites.
- A US university processed over 70,000 transactions with 90% of IT staff time recovered on late returns.
Smart Collect® runs natively inside the customer’s existing ServiceNow tenant, inheriting RBAC, audit trail and CMDB structure as native configuration items rather than syncing a parallel database. There is no external data sync and no fresh vendor security review required.
Customers span pharma and life sciences, energy and utilities, defence and aerospace, legal services, financial services and higher education, sectors where audit continuity is not negotiable.
How employee experience in IT shapes engagement and retention
Friction in device fulfilment does not stay contained to a single ticket. It compounds into how employees feel about the organisation more broadly, and IT leaders who treat experience as a satisfaction-survey afterthought consistently underestimate this link.
That is not a helpdesk statistic; it is a retention statistic wearing an IT badge. When someone waits three days for a replacement laptop while trying to hit a deadline, the frustration attaches to the employer, not to the specific technician who happened to be dispatched.
The retention link runs through trust as much as through time lost. An employee who reports an issue and gets a fast, well-handled resolution builds confidence that raising problems is worthwhile. An employee who reports an issue and waits, chases, and re-explains the problem to a second technician after a handoff learns the opposite lesson quickly. That is precisely the mechanism behind the finding that more than a considerable number of employees have stopped reporting IT issues — not because the issues went away, but because raising them stopped feeling worth the effort.
For CIOs, this reframes device fulfilment speed as a talent-retention lever alongside pay and progression, not a separate operational silo. Engagement scores measured through annual surveys will always lag the daily reality of how long someone waited for a working laptop, so the leading indicator worth tracking is the operational one, not the annual one.
Feedback mechanisms and continuous improvement in employee experience
A fulfilment programme without a feedback loop degrades quietly. The devices still get delivered, but the specific friction points that erode experience keep recurring because nobody is measuring them at the moment they happen.
The most useful feedback signal is not the annual engagement survey. It is a short, transactional prompt captured immediately after a locker collection, a vending dispense or a kiosk resolution, timestamped against the fulfilment event itself. This is exactly the join HappySignals’ benchmark methodology depends on: pairing an experience rating with an operational timestamp turns a vague satisfaction number into an actionable diagnosis of which workflow step is failing.
Continuous improvement in this context means three recurring disciplines rather than a one-off project:
- Review handoff-heavy ticket categories monthly, since the a small percentage of tickets with multiple reassignments remain the highest-value target for process redesign.
- Track first-time fix rate by site and device type, not just in aggregate, because regional variance usually points to a specific integration or stocking gap.
- Feed return-enforcement and overdue-loaner data back to line managers, closing the loop between IT policy and the behaviour that actually causes asset loss.
Platforms with a native ITSM connector make this loop far easier to sustain, because the feedback prompt, the fulfilment timestamp and the CMDB custody event all live in one system rather than three disconnected tools requiring manual correlation. Without that native structure, continuous improvement tends to collapse into an annual review exercise, which is far too slow to catch a handoff pattern before it becomes a quarter’s worth of lost productivity.
Beyond hardware: software tools and interfaces that complete the experience
Hardware fulfilment solves the physical handover. It does not solve the interface problem sitting in front of it, and CIOs who focus purely on locker throughput while ignoring the request experience will still see mediocre satisfaction scores.
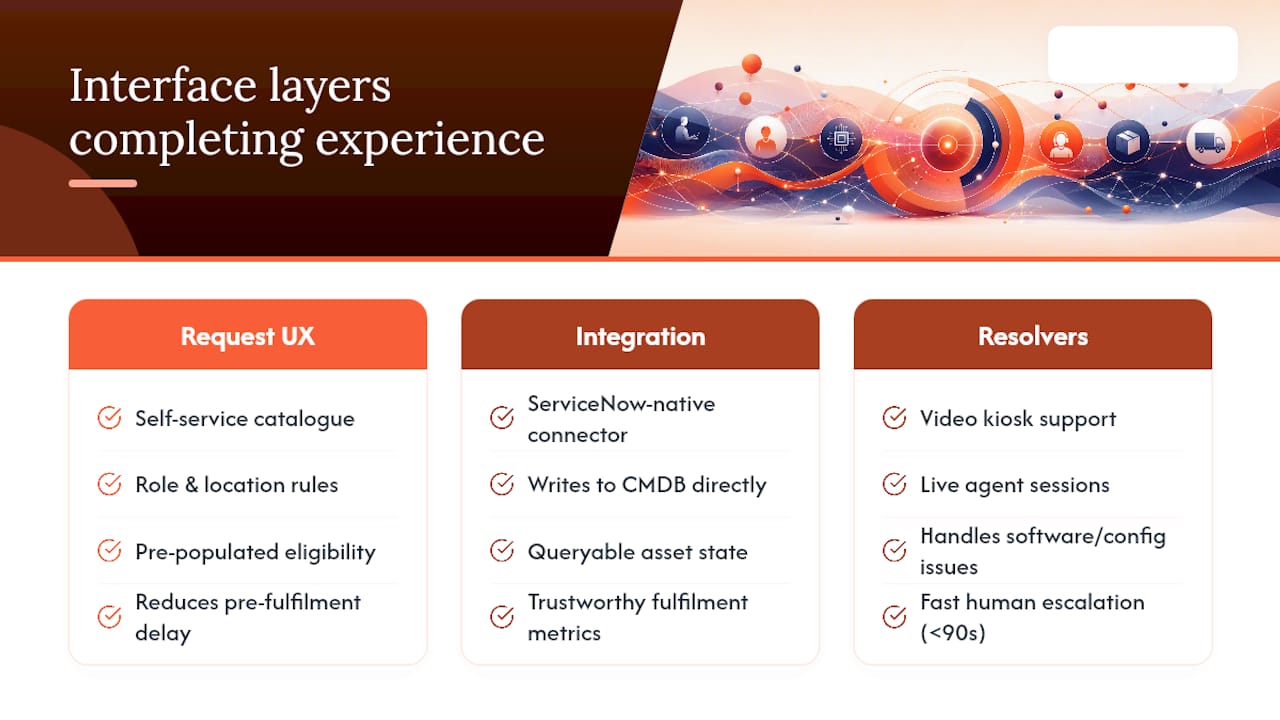
The request journey matters as much as the collection journey. An employee who has to navigate a generic ticket form, guess at a category, and wait for triage before a locker code is even issued has already absorbed a chunk of the delay that a well-designed self-service interface would eliminate. ServiceNow-native request catalogues, pre-populated with device eligibility rules tied to role and location, cut that pre-fulfilment friction before the physical process even starts.
Software integration also determines whether fulfilment data becomes useful. A ServiceNow-native connector writing directly to the CMDB means asset state, custody history and ownership sit as queryable configuration items alongside every other IT asset, not as a separate export that someone reconciles manually each month. That single design decision is what determines whether the metrics described earlier in this article are trustworthy or approximate.
Video-based resolver interfaces extend this further. A kiosk paired with a live support agent over video handles the category of issue that a locker or vending machine cannot: configuration problems, software faults, or a question that genuinely needs a conversation. The interface layer, not the hardware, is what decides whether that conversation happens in ninety seconds or after a ticket sits in a queue for a day. Partner perspectives on designing AI-assisted helpdesk workflows make a similar point: automation only improves experience when the escalation path to a human is fast and well-defined, not buried behind a chatbot loop.
What successful IT experience programmes actually look like
The pattern across the strongest documented outcomes is narrower scope followed by faster measurement, not a big-bang enterprise rollout. Programmes that try to fix every workflow simultaneously tend to produce weak, unattributable results; programmes that target the highest-friction ticket category first produce numbers a CFO will actually believe.
A pharmaceutical enterprise running Smart Collect® across the US, Switzerland, Germany and China focused first on device swap and new-starter provisioning, the two workflows generating the highest ticket volume and the longest wait times.
A US nuclear energy operator took a different entry point, targeting on-site ticket volume specifically because travel and access restrictions at regulated facilities made every dispatched engineer visit expensive.
A US university’s programme succeeded by targeting a single administrative pain point: loaner and equipment return compliance across a large, transient population of students and staff.
The consistent lesson across all three: pick the single workflow costing the most in hidden staff time, automate it natively rather than bolting on middleware, and measure the specific metric that workflow was draining before claiming a wider experience win.
Common pitfalls that undermine employee experience programmes
Most employee experience initiatives in IT fail quietly rather than dramatically. They launch, generate a modest improvement, and then plateau because of a handful of recurring design mistakes.
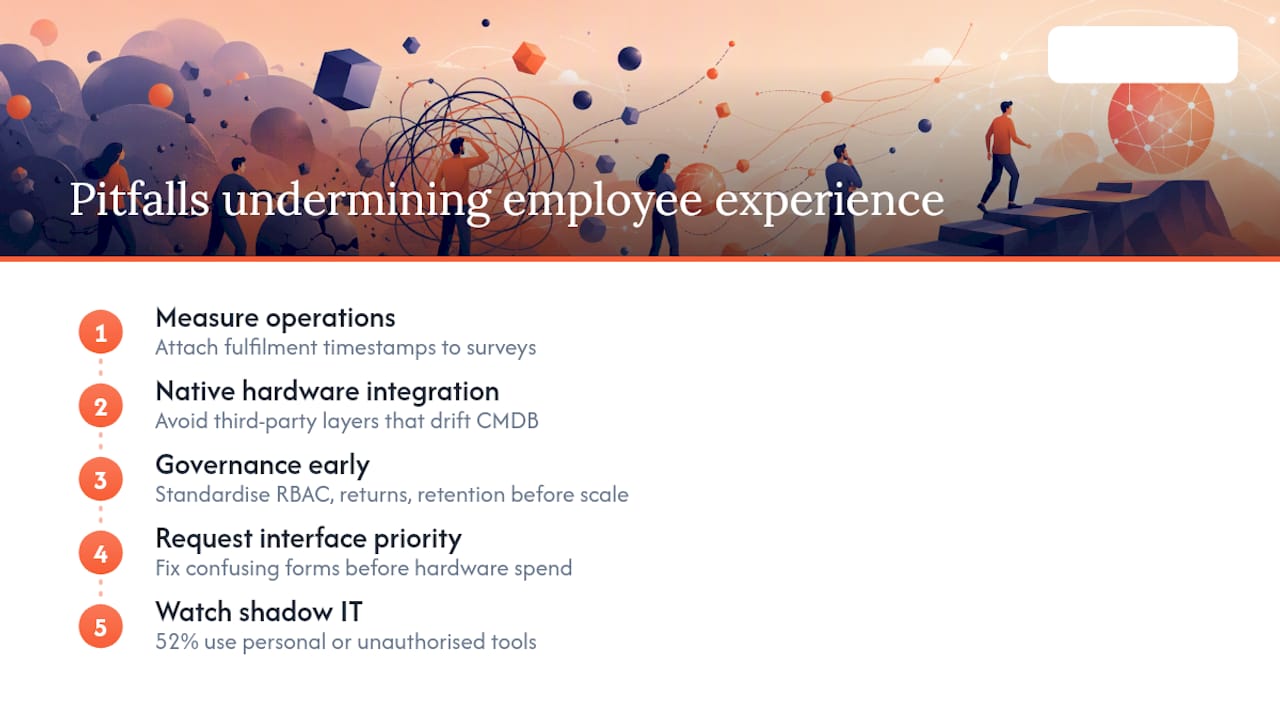
The first is measuring satisfaction without measuring operations. A survey score with no fulfilment timestamp attached tells you employees are frustrated but not which specific step caused it, so improvement plans end up guessing rather than targeting the a small percentage of tickets actually responsible for most lost time.
The second is treating hardware as middleware territory. Bolting a locker or kiosk onto ServiceNow through a third-party integration layer rather than a native connector creates a parallel data set that drifts out of sync with the CMDB, undermining exactly the audit continuity that regulated industries need most.
The third is skipping governance until scale forces the issue. RBAC rules, return-enforcement escalation and audit retention policy are far easier to standardise before a second and third site come online than to retrofit across five sites with five slightly different local practices.
The fourth is under-investing in the request interface while over-investing in the hardware. A beautifully engineered locker wall does nothing for experience if employees still spend ten minutes navigating a confusing request form to get the collection code.
The fifth, and the most expensive because it is invisible, is ignoring the shadow IT signal. When 52% of employees turn to personal devices or unauthorised tools rather than raising a ticket, that behaviour rarely shows up in a satisfaction survey precisely because those employees have stopped participating in the feedback loop altogether.
Where employee experience technology in IT is heading
Agentic AI is already automating one layer of the IT stack after another, and by 2029 Gartner expects the majority of common service issues to resolve autonomously, with meaningful cost reduction across service operations. That trend leaves one layer conspicuously untouched: the moment a workflow needs a physical device handed over, a human still has to show up, regardless of how intelligent the ticket triage upstream has become.
The near-term trend worth watching is the narrowing of that gap between digital resolution cost and physical fulfilment cost. As AI collapses the cost of resolving software issues toward zero, the cost differential against a physical dispatch, already roughly three times higher for desktop support than a digital ticket, will widen further rather than close on its own.
The practical implication for platform owners is architectural, not aspirational: physical fulfilment needs to sit natively inside the same ServiceNow workflow that AI agents are increasingly orchestrating, so that when an agent determines a device swap is the correct resolution, it can trigger a locker or kiosk handover without a separate system, a separate login, or a manual dispatch step breaking the chain. Programmes built on middleware integrations today will face a harder migration later than programmes built natively from the outset.
The overlooked truth about employee experience in IT
Most advice on employee experience treats it as a communications problem: better surveys, better onboarding emails, more empathetic support scripts. The evidence points somewhere less comfortable for IT leadership. The dominant driver of poor experience is structural, not attitudinal: it is the number of handoffs a ticket goes through and the minutes it takes to physically get a working device into someone’s hands.
That reframing matters because it changes where budget should go. Training a service desk to sound friendlier will not move the 3.3 hour average meaningfully if the bottleneck is a technician needing to travel across a campus to deliver a laptop. Automating that specific handover, and recording the custody event natively where the rest of the ITSM workflow already lives, addresses the actual mechanism rather than the symptom.
The conventional advice also underrates how much shadow IT is really a symptom of poor fulfilment rather than poor communication. Employees who stop reporting issues are not becoming less engaged in the abstract; they are responding rationally to a process that wastes their time. Fix the process and the reporting behaviour tends to follow.
If there is one priority for a CIO reading this, it is to instrument the handoff-heavy ticket categories first, not the whole estate. That is where the fastest, most defensible ROI sits, and it is the evidence base every credible automation case should be built on.
— Anthony
Where to learn more about Smart Collect® and request a briefing
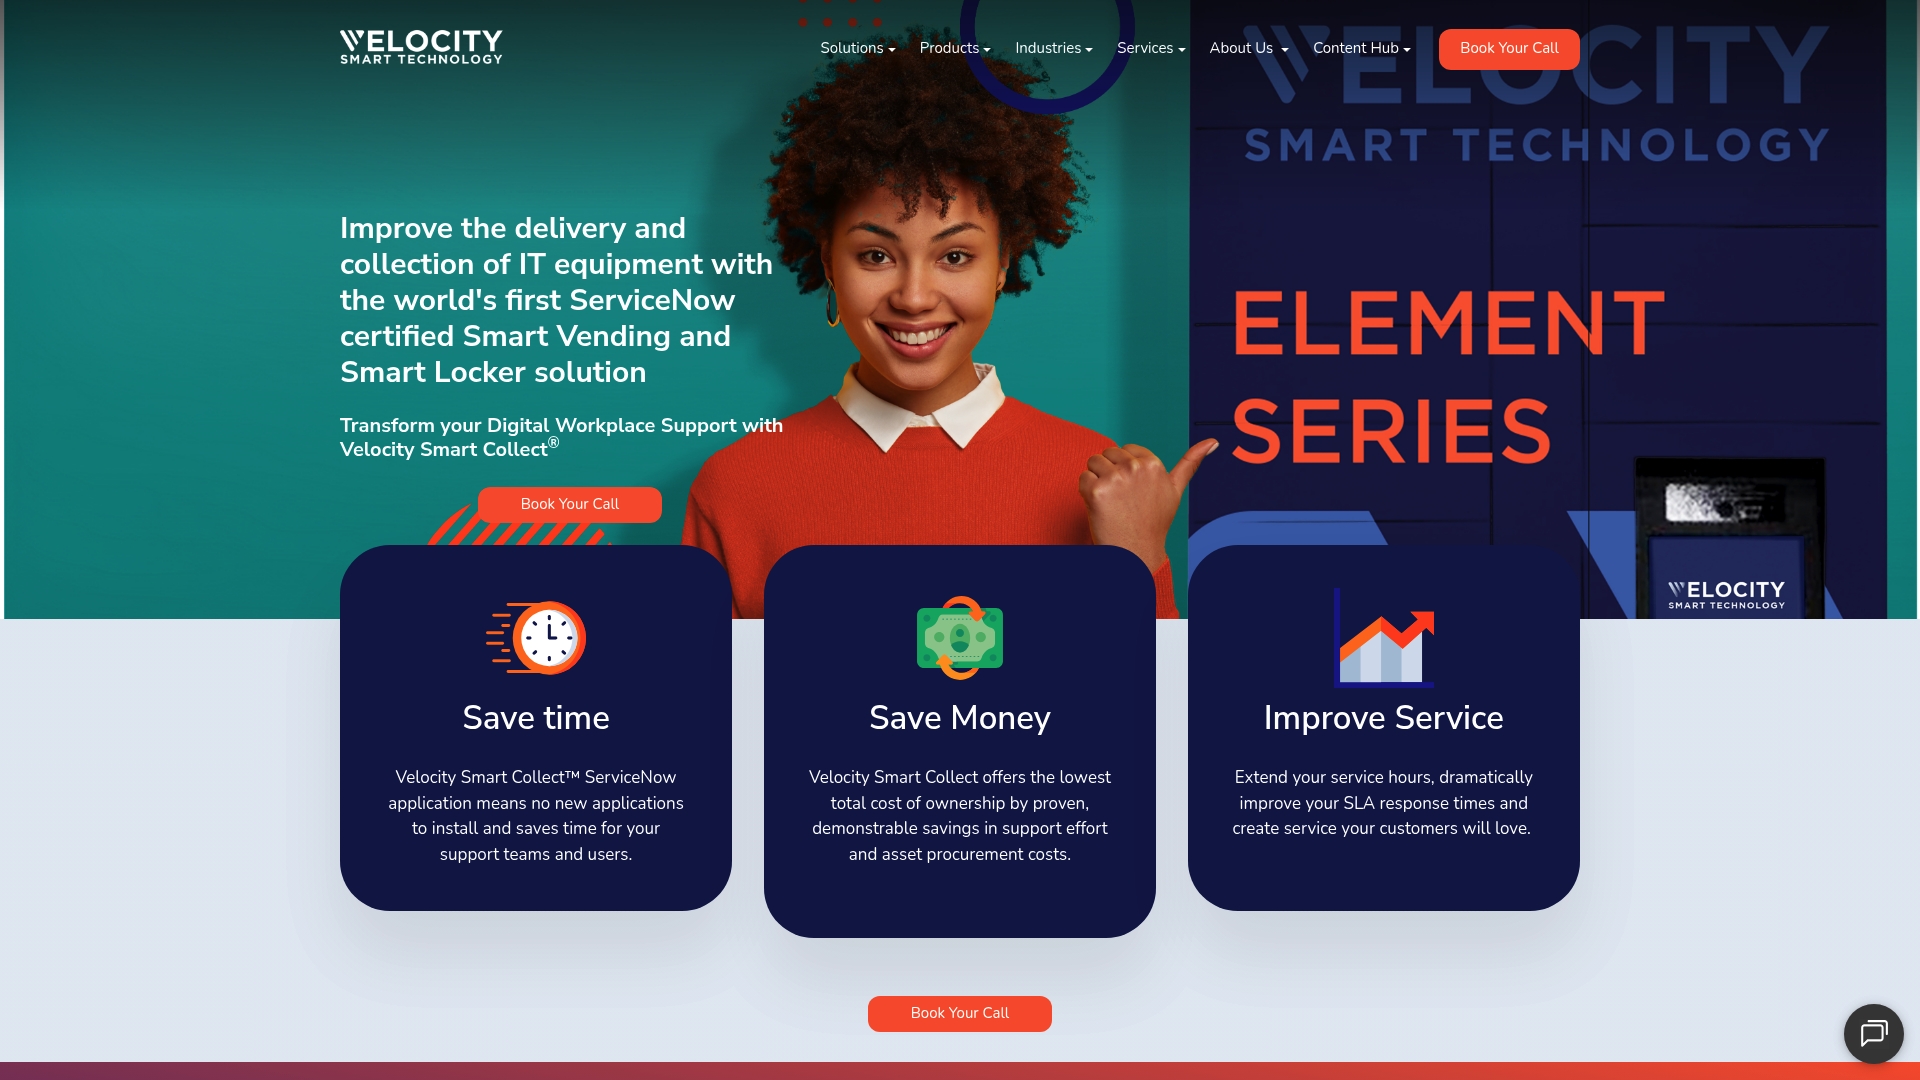
Smart Collect® is built for exactly the gap this article has described: the physical handover step that no amount of AI ticket triage can close on its own. It runs natively inside your existing ServiceNow tenant, so lockers, vending and kiosk fulfilment write custody events straight into your CMDB using your current RBAC and audit trail, with no middleware layer and no separate security review.
That is the floor these programmes deliver from, not the ceiling.
If you are scoping a pilot, start with the workflow generating your highest handoff volume, whether that is device swaps, new-starter kit or loaner recovery. Review the self-service hardware options available, look at the IT asset locker form factor for full-device handovers, and get in touch to scope a site-level briefing against your own ticket data.
Sources
- HappySignals’ Global Benchmark 2026: Employees lose more than three hours of productivity per IT incident
- Ivanti 2025 digital employee experience report
- Employees are giving up on IT departments
Recommended
See what Smart Collect® could save you
Model your savings in two minutes, or book a 60-minute workshop to pressure-test the numbers against your estate.