 What is asset utilisation? A guide for enterprise leaders">
What is asset utilisation? A guide for enterprise leaders
TL;DR:
- Asset utilisation measures the percentage of time or capacity an asset is actively and productively used relative to its total available potential. Monitoring and improving this metric help enterprises reduce costs, optimize capacity, and support sustainable growth while avoiding over-utilisation risks. Effective utilisation considers output quality and value creation, offering a more accurate reflection of asset performance beyond mere operational time.
Asset utilisation is defined as the percentage of time or capacity that a company’s assets are actively and productively used relative to their total available time or potential output. For enterprise decision-makers, this metric sits at the intersection of operational efficiency and financial performance, revealing where capital is working hard and where it is sitting idle. Measured through tools such as Overall Equipment Effectiveness (OEE), GPS telematics, and financial asset turnover ratios, utilisation data translates raw asset inventories into strategic intelligence. Organisations that track and act on this metric consistently find clearer paths to cost reduction, capacity planning, and sustainable growth.
What is asset utilisation and how is it calculated?
Asset utilisation is measured through two distinct lenses: financial and operational. The financial formula divides net sales by average total assets, producing a ratio that tells analysts how efficiently a business generates revenue from its asset base. The operational formula calculates the percentage of available capacity actively used: [(Total Potential Hours minus Idle and Downtime Hours) divided by Total Potential Hours] multiplied by 100.
Applying the operational formula in practice requires a structured four-step process. Mapsted’s calculation framework defines it as follows:
- Identify total available hours for the asset over the measurement period (a shift, week, or month).
- Sum all downtime, including both scheduled maintenance windows and unscheduled breakdowns.
- Add quality loss hours, converting defective or substandard output into equivalent lost productive time.
- Calculate net productive time by subtracting total downtime and quality losses from available hours, then express this as a percentage.
To illustrate: a manufacturing press available for 720 hours per month that experiences 80 hours of downtime and 40 hours producing defective parts has a net productive time of 600 hours. Its utilisation rate is 83.3%. Without step three, the figure would appear as 88.9%, a meaningful overstatement that could mask a quality problem.
| Input | Value |
|---|---|
| Total available hours | 720 hrs |
| Scheduled and unscheduled downtime | 80 hrs |
| Quality loss hours | 40 hrs |
| Net productive time | 600 hrs |
| Utilisation rate | 83.3% |

Pro Tip: The most common calculation error is omitting quality loss hours entirely. An asset producing defective output is not productively utilised, and failing to account for this inflates the reported rate while hiding the real bottleneck.
What benchmarks define good asset utilisation?
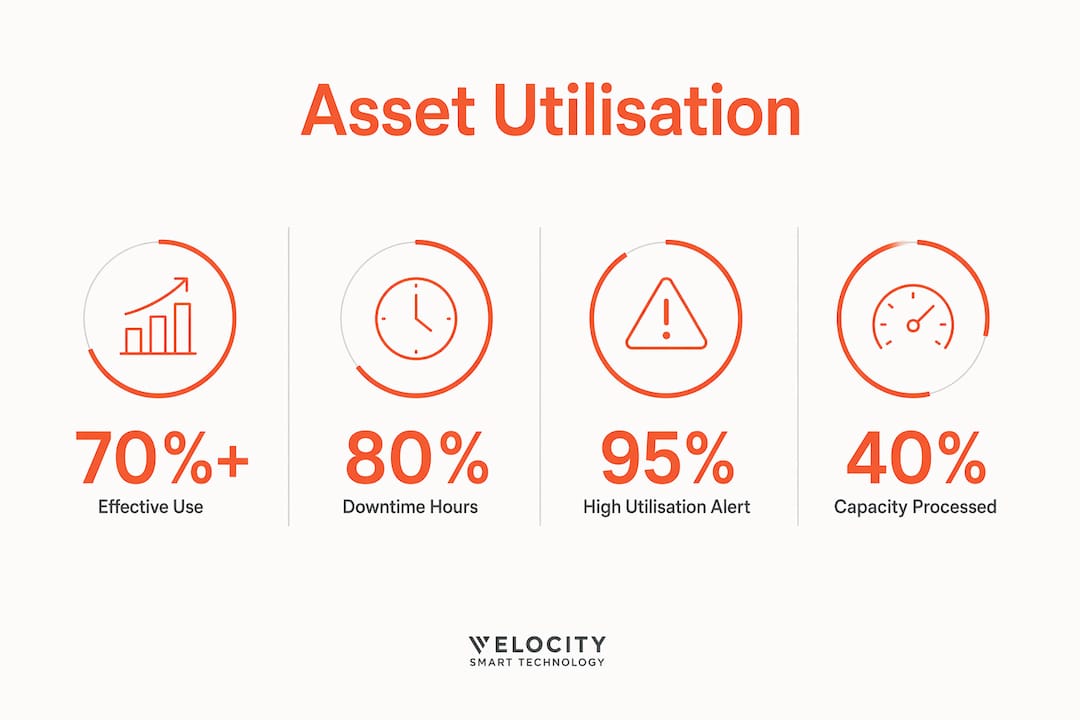
A utilisation score of 70% or above is the widely adopted industry threshold for effective asset use. Scores below this level typically indicate excess capacity, scheduling inefficiencies, or underinvestment in demand generation. This benchmark applies broadly across manufacturing, construction, logistics, and IT asset management, though sector-specific norms vary.
The more nuanced challenge is interpreting scores above 90%. High utilisation is not unconditionally positive. Consider the following ranges and their operational implications:
| Utilisation range | Operational implication |
|---|---|
| Below 50% | Significant idle capacity; review asset necessity or redeploy |
| 50% to 69% | Below benchmark; investigate scheduling gaps and demand patterns |
| 70% to 85% | Effective range; assets are productive with capacity for maintenance |
| 86% to 95% | High performance; monitor maintenance deferral risk closely |
| Above 95% | Potential over-utilisation; assess equipment stress and safety exposure |
The critical insight here is that high utilisation can signal deferred maintenance, increasing the long-term risk of equipment failure despite apparent productivity gains. A construction crane running at 97% utilisation for six consecutive months may look excellent on a dashboard while accumulating fatigue stress that a preventive maintenance schedule would have caught. The benchmark, therefore, is not a target to maximise but a range to manage within.
- Scores in the 70% to 85% band allow time for scheduled maintenance without sacrificing throughput.
- Scores persistently above 90% warrant a review of whether demand can be redistributed across additional assets.
- Scores below 50% call for a strategic decision: redeploy, consolidate, or divest.
How does asset utilisation differ from equipment efficiency and effective utilisation?
These three terms are frequently conflated, and the confusion leads to poor management decisions. Utilisation differs from performance: an asset can run continuously at 100% utilisation while delivering poor value if it is producing at reduced speed, generating defects, or performing tasks that do not contribute to business outcomes.
The distinctions matter in practice:
- Asset utilisation measures the proportion of available time an asset is in operation, regardless of output quality or speed.
- Equipment efficiency (often the performance component within OEE) measures how closely actual output matches the theoretical maximum during operating time.
- Effective utilisation combines both dimensions, factoring in value-added time versus raw operational time to reflect genuine contribution to business outcomes.
A server farm running at 95% uptime but processing only 40% of its theoretical transaction capacity is highly utilised but poorly efficient. For IT asset management in enterprise environments, this distinction is particularly consequential: a laptop issued to an employee but sitting unused in a drawer registers as utilised in many tracking systems, yet delivers zero value. Effective utilisation corrects for this by anchoring the metric to productive output rather than mere availability.
Pro Tip: When reporting to senior leadership, present effective utilisation alongside raw utilisation. The gap between the two figures is where the real improvement opportunity lives.
What strategies can enterprises apply to improve asset utilisation?
Improving utilisation is not a single intervention but a set of coordinated practices applied across maintenance, technology, operations, and workforce behaviour.
- Implement preventive maintenance schedules. Assets that are well-maintained spend less unplanned time offline. Scheduling maintenance during low-demand windows preserves productive capacity without sacrificing equipment health.
- Deploy real-time tracking and telematics. GPS and telematics platforms automate utilisation monitoring, replacing manual logs with live dashboards that surface idle assets, location data, and usage patterns. This is particularly valuable for distributed fleets and multi-site IT hardware estates.
- Apply capacity planning and demand smoothing. Peaks and troughs in asset demand create artificial utilisation gaps. Scheduling tools that spread workloads more evenly across assets and time periods raise average utilisation without adding capital expenditure.
- Adopt lean practices and reduce changeover times. In manufacturing and logistics, techniques such as Single-Minute Exchange of Die (SMED) reduce the time assets spend transitioning between tasks, directly increasing productive hours.
- Integrate utilisation data with financial planning. Utilisation metrics fed into capital expenditure models help finance teams make evidence-based decisions about asset acquisition, disposal, and lease versus buy choices.
For IT operations specifically, automating device distribution and support removes the manual handover steps that create idle time between asset availability and productive deployment. A laptop sitting in an IT storeroom waiting for a technician to process a ticket is an underutilised asset by any definition.
“The organisations that extract the most value from their asset base are not those with the most assets. They are those with the clearest visibility into how each asset is being used and the operational discipline to act on that data.”
What are the common pitfalls in interpreting asset utilisation data?
The metric is only as reliable as the methodology behind it, and several structural errors consistently distort utilisation reporting in large enterprises.
Denominator ambiguity is the most pervasive issue. Practitioners must choose between total annual hours (8,760 for a continuously available asset) and scheduled operating hours (which exclude planned maintenance, holidays, and non-production shifts). Using total annual hours suits capacity benchmarking across an industry; using scheduled hours suits operational performance analysis within a facility. Mixing the two denominators across reporting periods produces trend data that is not comparable and can mislead investment decisions.
Ignoring quality losses is equally damaging. Defective outputs should be converted into equivalent lost productive hours and subtracted from available time. Organisations that skip this step systematically overstate their utilisation rates and underestimate the cost of poor quality.
Additional pitfalls worth noting:
- High utilisation masking safety risk. Monitoring utilisation shifts organisations from reactive to proactive safety management. Assets running above sustainable thresholds accumulate stress that increases the probability of workplace incidents.
- Time-based metrics without throughput correlation. High utilisation paired with low throughput may indicate equipment wear, upstream supply constraints, or operator inefficiency. A packaging line running 90% of available hours but producing 60% of its rated output is signalling a problem that utilisation alone cannot diagnose.
- Sector-specific misapplication. In construction, utilisation is often measured against project-scheduled hours rather than calendar hours, making cross-sector comparisons unreliable. In IT, a device assigned to a user is frequently counted as utilised even when it has not been powered on for weeks.
The corrective discipline is to correlate time-based utilisation rates with throughput metrics such as cycles, transactions, or units per hour. This pairing prevents misleading conclusions and supports more strategic asset management across complex, multi-site operations.
Key takeaways
Effective asset utilisation requires combining accurate calculation methods with contextual interpretation, because a single percentage figure rarely tells the complete operational story.
| Point | Details |
|---|---|
| Definition and formula | Utilisation is net productive time divided by total available time, expressed as a percentage. |
| The 70% benchmark | Scores above 70% indicate effective use; scores above 95% warrant maintenance and safety review. |
| Effective vs raw utilisation | Effective utilisation accounts for value-added output, not just operational time, and is the more useful management metric. |
| Denominator discipline | Choose between total annual hours and scheduled hours consistently to maintain comparable trend data. |
| Quality losses matter | Converting defective output into lost productive hours prevents systematic overstatement of utilisation rates. |
Asset utilisation in practice: what the data rarely tells you
Having worked alongside IT operations and asset management teams across large enterprises, I find that the most persistent problem is not a lack of data. It is a lack of interpretive discipline around the data that already exists.
Most organisations can produce a utilisation percentage within minutes. Far fewer can answer the follow-up question: utilised to do what? A server running continuously to process a deprecated application, a fleet vehicle making low-value journeys to fill a schedule, a laptop assigned but never logged into. These all score well on raw utilisation and deliver poor value. The shift from measuring uptime to measuring productive contribution is where mature asset management programmes separate themselves from the rest.
The second observation I would offer is that IoT and automation are changing the cost of getting this right. Real-time telematics and smart solutions for asset tracking have removed the manual data collection burden that historically made granular utilisation monitoring impractical at scale. Enterprises that invested in this infrastructure three years ago are now making capital allocation decisions with a level of confidence that was simply not available before.
My advice to decision-makers is this: embed utilisation metrics into your quarterly business reviews alongside financial KPIs, not as an operational footnote. The gap between your reported utilisation rate and your effective utilisation rate is a number your CFO should see. It represents capital that is deployed but not working.
— Anthony
How Velocity-smart helps enterprises improve asset utilisation

Velocity-smart’s Smart Collect platform addresses one of the most overlooked sources of asset underutilisation in enterprise IT: the physical handover gap. When devices sit in IT storerooms waiting for manual processing, or peripherals are unavailable because no technician is on shift, utilisation rates fall and employee productivity suffers. Velocity-smart’s smart locker and vending automation runs natively inside ServiceNow, giving IT operations teams real-time visibility into device location, availability, and usage history without a separate tracking system. Customers including Roche, BAE Systems, and Entergy have used this infrastructure to cut idle device time, reduce loss, and reclaim IT staff capacity for higher-value work.
FAQ
What is the asset utilisation definition in simple terms?
Asset utilisation is the percentage of an asset’s available time or capacity that is actively and productively used. It measures how effectively a business deploys its physical or financial resources to generate output or revenue.
How do you measure asset utilisation in an enterprise?
The operational formula is: (Net Productive Time divided by Total Available Hours) multiplied by 100, where net productive time subtracts both downtime and quality loss hours from total availability. Financial measurement uses the net sales to average total assets ratio.
What is a good asset utilisation rate?
A score of 70% or above is the widely accepted benchmark for effective asset use across most industries. Scores persistently above 95% require scrutiny, as they may indicate deferred maintenance and elevated equipment stress.
Why does asset utilisation matter for large enterprises?
Poor utilisation ties up capital in underperforming assets, inflates operating costs, and obscures where investment is genuinely needed. For enterprises managing hundreds or thousands of assets across multiple sites, even a modest improvement in utilisation rates translates directly into measurable cost savings and capacity gains.
What is the difference between asset utilisation and effective utilisation?
Raw asset utilisation measures the proportion of time an asset is in operation. Effective utilisation adjusts for output quality and value-added time, reflecting the asset’s actual contribution to business outcomes rather than simply its operational hours.
Recommended
See what Smart Collect® could save you
Model your savings in two minutes, or book a 60-minute workshop to pressure-test the numbers against your estate.